Monday, September 8, 2014

Euro Semakin Rapuh Menjelang Pengumuman Tingkat Suku Bunga


Sekilas Forex: Euro Semakin Rapuh Menjelang Pengumuman Tingkat Suku Bunga

Image

ForexSignal88.Com | Jakarta, 01/09/2014.  Penutupan Bulan Agustus tidak memberikan berita bagus baik bagi mata uang tunggal Euro.  Pasalnya sentimen Euro semakin meredup dan harga pun semakin terpuruk terhadap counterpartnya USD. 

Ketakutan investor semakin terlihat akan adanya cerita lanjutan dari kebijakan ECB seiring dengan semakin lemahnya perkembangan ekonomi.  Bagaimana pergerakan Euro untuk pekan depan? Mari kita simak

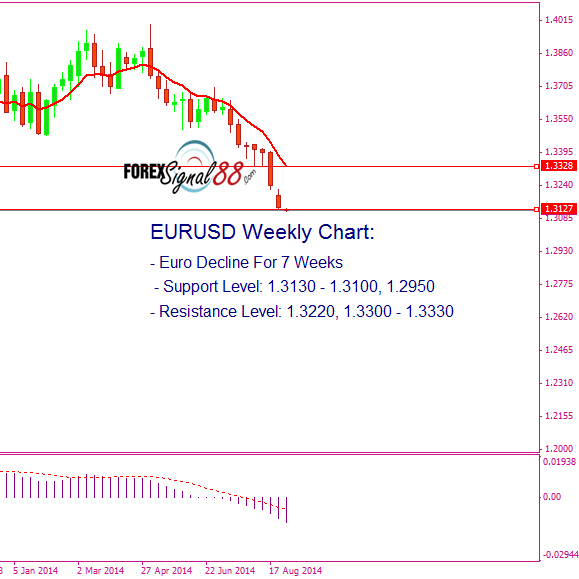
EURUSD pada pekan lalu kembali mencatatkan rekor penurunan untuk minggu ke-7 selama beruntun.  Pekan lalu Euro hanya mampu mencapai harga tertinggi pada harga 1.3219 terhadap USD dan harus menyerah untuk mencapai harga terendah pada angka 1.3132.  Semakin anjloknya nilai Euro ini seiring dengan kekawatiran investor dan pelaku pasar akan perkembangan data inflasi yang mengecewakan.

Data inflasi yang diumumkan pada Jumat lalu mencatatkan penurunan dari 0.4% ke 0.3%.  Data ini jauh dari target ECB yang menargetkan 2.0% sebagai target inflasi dan juga masih jauh dibawah batas zona berbahaya ECB pada 1%.  Jika Inflasi jangka menengah tercatat rendah, ECB mengkawatirkan bahwa Inflasi aktual pun akan semakin sulit di dekati.  Berdasarkan ini maka pada pekan depan penting untuk diikuti oleh para penggemar mata uang Euro.

Ada apa pekan Depan bagi Euro?
  Pekan depan ada 2 event penting yang patut diikuti yaitu: Pengumuman Tingkat Suku Bunga dan Pidato Mario Draghi ECB.

Seperti diketahui bahwa Euro beberapa bulan lalu Euro berani kembali memangkas tingkat suku bunga ke rekor terendahnya pada angka 0.15%.  Ini semakin membuat Euro semakin tidak menarik bagi investor.  Kali ini dengan ancaman target inflasi yang masih jauh dari pencapaian.  Kita lihat apakah Draghi akan kembali memangkas suku bunga ECB?  atau juga apakah Draghi akan kembali mengucurkan dana bantuan ke dalam ekonomi untuk mengkatrol perbaikan ekonomi untuk kembali ke jalur yang sesuai.

Ini adalah hal-hal yang patut kita ikuti pekan depan.  Namun perlu diingat bahwa Draghi sebenarnya lebih memilih Euro untuk turun secara value karena dinilai sudah terlalu tinggi.  Draghi menilai tingginya nilai Euro dapat membebankan pemulihan ekonomi itu sendiri.  Apakah yang akan terjadi? Kita akan lihat pekan depan.


WEEKLY OUTLOOK EURUSD:
BEARISH

Sentimen teknikal mingguan memperlihatkan trend bearish yang semakin jelas.  Saat ini support yang menahan Euro ada pada kisaran harga 1.3130 - 1.3100.  Harga 1.3100 menjadi semakin penting pada pekan depan dan jika mampu ditembus maka perjalanan Euro akan semakin anjlok menuju kepada support berikutnya pada 1.3000 atau bahkan 1.2950.

Sebaliknya jika Euro melakukan rebound dari titik tersebut diatas, maka Euro akan kembali kepada resistance pada harga 1.3220 atau bahkan lebih tinggi pada resistance mingguannya pada angka 1.3330 .  Pidato Draghi serta Tingkat suku bunga akan memberikan gerakan tersendiri karena berita ini akan paling ditunggu-tunggu oleh para investor.
Image
GBPUSD

WEEKLY OUTLOOK:
 NETRAL

Pound berhasil rebound pada titik support mingguan.  Pound sempat mencapai harga terendah mingguan pada angka 1.6535 sebelum berhasil rebound dan menembus 1.6600 dan mencapai harga tertinggi pada 1.6613.  Pekan lalu tidak banyak pergerakan yang datang dari sepinya data ekonomi yang diumumkan.  Namun pekan depan Pound dapat disibukan oleh beberapa data penting seperti: Tingkat Suku Bunga, Pidato BOE, Manufacturing PMI, Services PMI, Construction PMI serta Asset Purchase Facility.

Secara teknikal GBPUSD sentimen mingguan semakin menunjukan pelemahan.  Namun rebound yang terjadi pada pekan lalu menjadi pernyataan bahwa masih adanya harapan yang diletakan kepada Pound akan dipercepatnya kenaikan suku bunga.  Pada pekan depan investor akan melihat apakah akan ada kenaikan suku bunga atau paling tidak ada komentar yang mendukung kearah tersebut.

Saat ini 1.6535 akan terus menjadi support dan jika memang berhasil ditembus maka potensi untuk turun lebih lanjut akan terbuka.  Jika turun, GBPUSD akan menuju ke harga 1.6465.  Sebaliknya jika GBPUSD naik maka GBPUSD harus bisa menembus resistance 1.6620 dan jika berhasil menembus maka akan menuju kepada resistance berikutnya pada angka 1.6685.


AUDUSD

WEEKLY OUTLOOK:
NETRAL

AUDUSD hanya berhasil mencatatkan kenaikan sedikit pada pekan lalu.  Mencatatkan angka tertinggi pada harga 0.9373 dan mencapai harga terendah pada harga 0.9271.  Data ekonomi Australia relatif sepi pada pekan lalu, namun pekan depan bisa lain ceritanya.  Pada pekan depan, akan ada beberapa data penting seperti Bulidng Approvals, Retail Sales, Trade Balance.  Namun beberapa yang terpenting adalah: Tingkat Suku Bunga, Pidato RBA serta data GDP q/q.

Secara teknikal AUDUSD masih berjalan stabil dan masih dapat dikategorikan range trading dalam gerakan mingguan.  Untuk mencatatkan bullish dan naik maka AUDUSD harus berhasil melampaui resistance 0.9375.  Jika berhasil maka AUDUSD berpotensi untuk mencapai 0.9430 atau bahkan lebih.  Sebaliknya titik support mingguan berada pada angka 0.9235, penembusan titik ini akan membuat AUDUSD kembali menjadi bearish.
XAUUSD

WEEKLY OUTLOOK: 
NETRAL
Pekan lalu XAUUSD berhasil mencatatkan kenaikan dengan mencapai level tertinggi pada harga $1296.20 setelah sebelumnya terpuruk sampai ke level harga $1274.25.  XAUUSD memang berhasil rebound pada pekan lalu, namun kondisi XAUUSD masih dihantui potensi bearish.  Secara sentimen mingguan XAUUSD sudah mulai bearish yang diiringi kenaikan pekan lalu masih tetap dibawah resistance $1300.00. 

XAUUSD akan banyak dipengaruhi oleh data USD pada pekan depan.  Banyak data-data penting yang akan diumumkan seperti ISM Manufacturing, Trade Balance, ISM Non-Manufacturing PMI.  Namun yang terpenting adalah data Non Farm Payroll dan Tingkat Pengangguran serta pidato para anggota FOMC.

Jika angin segar berhembus pada USD maka Gold diperkirakan akan sirna.  Untuk turun lebih jauh, XAUUSD harus mampu menembus suport level pada harga $1272.00.  Jika ini terjadi maka XAUUSD akan berpotensi terus menuju harga $1245.00 - $1240.00.  Sebaliknya jika ternyata giliran Gold menjadi bullish maka resistance $1300.00 harus mampu ditembus dan laju kenaikan akan menuju $1320.00.

Thursday, October 14, 2010

Daily Forex Signals and Predictions for October 15,

EUR/USD
It is hard to predict, May be after it goes down from around 1.40 or 1.3980, then it is more likely to go up to around 1.41.
(Current Price: 1.4031)
GBP/USD
It is also hard to predict, May be after from around 1.5960 or lower, then it is more likely to go up to around 1.6050, and after that, it might have potentially to go down.
(Current Price: 1.5996)
AUD/USD
No Comment
USD/JPY
No Comment
USD/CHF
No Comment

Daily Forex Signals and Predictions for October 14, 2010

EUR/USD
It is more likely to go up to around 1.4060 or higher, and after that it might have potentially to go up down to around 1.4
(Current Price: 1.4035)
GBP/USD
It is more likely to go up to around 1.60, and after that, it might have potentially to go down to around 1.5950.
(Current Price: 1.5947)
AUD/USD
May be it is more likely to go up to around 0.9970 or 1.0 , and after that, it might have potentially to go down to around 0.99.
(Current Price: 0.9962)
USD/JPY
After from around 81.40, then it is more likely to go up to around 82.
(Current Price: 81.57)
USD/CHF
After from around 0.9530, then it is more likely to go up to around 0.96, and then it will goes down again.
(Current Price: 0.9561)

Tuesday, April 27, 2010

Forex Analysis and Predictions for Apr 28, 2010

EUR/USD
It is more likely to go down to around 1.32 or may be 1.3170, and after that, it might have potentially to go up to around 1.33.
(Current Price: 1.3222)
GBP/USD
It is more likely to go down to around 1.5220 or may be lower than 1.52, and after that, it might have potentially to go up to around 1.53 or higher.
(Current Price: 1.5264)
AUD/USD
It is more likely to go down to around 0.9150 or 0.9120, and after that, it might have potentially to go up to around 0.92.
(Current Price: 0.9171)
USD/JPY
It is more likely to go up to around 93.50, and after that, it might have potentially to go down to around 93.
(Current Price: 93.08)
USD/CHF
It is more likely to go up to around 1.0880 or higher, and after that, it might have potentially to go down to around 1.08.
(Current Price: 1.0841)


Don’t be too late, and always check the posting time/update.


FOREX NEWS . Beware from the today news: (GMT+7 / Indonesia – Jakarta Time)
(see your time conversion at www.timeanddate.com)
05:30 AUD
06:50 JPY
08:30 AUD
15:30 EUR
(beware of the news revision or breaking news)

Monday, April 26, 2010

Forex Analysis and Predictions for Apr 27, 2010

EUR/USD
It is hard to predict, may be it is more likely to go up to around 1.34, and after that, it might have potentially to go down to around 1.33.
(Current Price: 1.3347)
GBP/USD
It is also hard to predict, may be after it goes down, then it is more likely to go up to around 1.55, and after that, it might have potentially to go down to around 1.54.
(Current Price: 1.5453)
AUD/USD
It is more likely to go up to around 0.9350, and after that, it might have potentially to go down to around 0.9280.
(Current Price: 0.9261)
USD/JPY
It is more likely to go down to around 93.60, and after that, it might have potentially to go up to around 94.
(Current Price: 94.05)
USD/CHF
It is more likely to go down to around 1.07, and after that, it might have potentially to go up to around 1.0780.
(Current Price: 1.0755)


Don’t be too late, and always check the posting time/update.


FOREX NEWS . Beware from the today news: (GMT+7 / Indonesia – Jakarta Time)
(see your time conversion at www.timeanddate.com)
08:30 AUD
13:00 CHF, EUR
15:30 GBP
17:00 GBP
20:00 USD
21:00 USD
21:15 EUR
(beware of the news revision or breaking news)

Sunday, April 25, 2010

Forex Analysis and Predictions for April 26, 2010

Beware of this Monday, because probably the market would move zig zag and complicated
EUR/USD
It is more likely to go up to around 1.34 or higher, and after that, it might have potentially to go down to around 1.33 or lower.
(Current Price: 1.3382)
GBP/USD
It is more likely to go up to around 1.54 or higher, and after that, it might have potentially to go down to around 1.53 or lower.
(Current Price: 1.5374)
AUD/USD
No Comment, because it is Bank Holiday in Australia
USD/JPY
No Comment
USD/CHF
It is more likely to go down to around 1.07 or lower, and after that, it might have potentially to go up to around 1.0780 or even 1.08.
(Current Price: 1.0722)


Don’t be too late, and always check the posting time/update.


FOREX NEWS . Beware from the today news: (GMT+7 / Indonesia – Jakarta Time)
(see your time conversion at www.timeanddate.com)
06:50 JPY
23:30 EUR
(beware of the news revision or breaking news)

Thursday, April 22, 2010

Forex Analysis and Predictions for April 23, 2010

EUR/USD
From around around 1.3280, it might have potentially to go up to around 1.3350 or may be 1.34. Looking for the best price to enter Buy.
(Current Price: 1.3306)
GBP/USD
From around 1.5350, it might have potentially to go up to around 1.54 or may be 1.55. Looking for the best price to enter Buy.
(Current Price: 1.5369)
AUD/USD
It is more likely to go down to around 0.9240 or lower, and after that, it might have potentially to go up to around 0.93.
(Current Price: 0.9264)
USD/JPY
It is more likely to go up to around 93.50, and after that, it might have potentially to go down to around 93.
(Current Price: 93.25)
USD/CHF
It is more likely to go up to around 1.0790, and after that, it might have potentially to go down to around 1.07.
(Current Price: 1.0774)


Don’t be too late, and always check the posting time/update.

FOREX NEWS . Beware from the today news: (GMT+7 / Indonesia – Jakarta Time)
(see your time conversion at www.timeanddate.com)
08:30 AUD
09:50 AUD
13:45 EUR
15:00 EUR
15:30 GBP
16:00 EUR
19:30 USD
21:00 USD
(beware of the news revision or breaking news)
Please Leave Comment

How to identify the trend with precise timing

Forex traders new to the "game" often
wonder if there's a real way to beat
the market on a daily basis.

There is...

But, you must know the big secret the
big bank and institutional
tycoons hope you don't find
out. You see, top-level traders go into
every trade with the odds stacked in
their favor.

http://clicks.aweber.com/y/ct/?l=DfAhZ&m=1bQJFc..CyrfNn&b=lnODEWqUBmLxvxbGuXGGgg


And, when the odds are on your side,
turning sizable profits consistently is
easier than you think.

What puts the odds in your favor?

It's simple: Having a proven system you
can count on.

Imagine if you had such a system. Every
time you placed a trade you could be
fairly confident it would make you money.

The question is: Does such a system exist?

Not only does it exist...but...it's been
relied on by a group of lucky traders for
the past couple of years.

Would you like to make money every day
from the forex market? If so...

Read This Now:

http://clicks.aweber.com/y/ct/?l=DfAhZ&m=1bQJFc..CyrfNn&b=lnODEWqUBmLxvxbGuXGGgg


Best regards.

Wednesday, April 21, 2010

Daily Forex Analysis and Predictions for April 22, 2010

EUR/USD
It is more likely to go up to around 1.3420, and after that, it might have potentially to go down to around 1.3350.
(Current Price: 1.3397)
GBP/USD
It is more likely to go up to around 1.5430, and after that, it might have potentially to go down to around 1.5360 or lower.
(Current Price: 1.5411)
AUD/USD
No Comment
USD/JPY
No Comment
USD/CHF
It is more likely to go down to around 1.0650, and after that, it might have potentially to go up to around 1.0730.
(Current Price: 1.0696)


Don’t be too late, and always check the posting time/update.
FOREX NEWS . Beware from the today news: (GMT+7 / Indonesia – Jakarta Time)
(see your time conversion at www.timeanddate.com)
06:50 JPY
08:30 AUD
13:15 CHF
14:00 EUR
15:30 GBP
18:00 EUR
19:30 USD
21:00 USD
(beware of the news revision or breaking news)

Forex Analysis and Prediction for April 22, 2010

Here's what's NEW at our Daily Forex Analysis over the past few hours. Your comments and feedback are always welcome.

Daily Forex Analysis and Prediction for April 22, 2010
(update: 1:10am GMT+7)
This is a News Schedule for Today that you need to be aware:
Times are in GMT+7 (Indonesia - Jakarta Time)
06:50 JPY
08:30 AUD
13:15 CHF
14:00 EUR
15:30 GBP
18:00 EUR
19:30 USD
21:00 USD
(beware of the revision)

Tuesday, April 20, 2010

Forex Analysis for April 21, 2010

EUR/USD
It is more likely to go up to around 1.35, and after that, it might have potentially to go down to around 1.34.
(Current Price: 1.3442)

GBP/USD
It is more likely to go up to around 1.54 or higher, and after that, it might have potentially to go down to around 1.53.
(Current Price: 1.5365)

AUD/USD
It is more likely to go up to around 0.9340, and after that, it might have potentially to go down to around 0.9270.
(Current Price: 0.9310)

USD/JPY
It is more likely to go down to around 93 or may be 92.60, and after that, it might have potentially to go up to around 93.50.
(Current Price: 93.14)

USD/CHF
It is more likely to go down to around 1.0620, and after that, it might have potentially to go up to around 1.0680.
(Current Price: 1.0678)


Don’t be too late, and always check the posting time/update.


FOREX NEWS . Beware from the today news: (GMT+7 / Indonesia – Jakarta Time)
(see your time conversion at www.timeanddate.com)
07:30 AUD
15:30 GBP
21:15 USD
(beware of the news revision or breaking news)

Monday, April 19, 2010

Predictions for April 20, 2010

EUR/USD
It is more likely to go up to around 1.35 or higher, and after that, it might have potentially to go down to around 1.34.
(Current Price: 1.3473)

GBP/USD
It is more likely to go up to around 1.5340 or may be 1.54, and after that, it might have potentially to go down to around 1.53.
(Current Price: 1.5302)

AUD/USD
It is more likely to go up to around 0.9230 or higher, and after that, it might have potentially to go down to around 0.92
(Current Price: 0.9207)

USD/JPY
It is more likely to go up to around 92.70 or may be 93, and after that, it might have potentially to go down to around 92.30.
(Current Price: 92.39)

USD/CHF
It is more likely to go down to around 1.06 or lower, and after that, it might have potentially to go up to around 1.0650.
(Current Price: 1.0637)


Don’t be too late, and always check the posting time/update.


FOREX NEWS . Beware from the today news: (GMT+7 / Indonesia – Jakarta Time)
(see your time conversion at www.timeanddate.com)
06:50 JPY
08:30 AUD
13:00 EUR
15:30 GBP (beware)
16:00 EUR
22:00 USD
(beware of the news revision or breaking news)

Sunday, April 18, 2010

Prediction for April 19, 2010

EUR/USD
It is more likely to go up to around 1.3550 or may be 1.36, and after that, it might have potentially to go down to around 1.35.
(Current Price: 1.3500)

GBP/USD
It is more likely to go up to around 1.5430 or higher, and after that, it might have potentially to go down to around 1.53.
(Current Price: 1.5360)

AUD/USD
It is more likely to go up to around 0.93, and after that, it might have potentially to go down to around 0.92.
(Current Price: 0.9244)

USD/JPY
It is more likely to go down to around 91.80 or lower, and after that, it might have potentially to go up to around 92.
(Current Price: 92.15)

USD/CHF
It is more likely to go down to around 1.0570 , and after that, it might have potentially to go up to around 1.0650.
(Current Price: 1.0612)


Don’t be too late, and always check the posting time/update.


FOREX NEWS . Beware from the today news: (GMT+7 / Indonesia – Jakarta Time)
(see your time conversion at www.timeanddate.com)
06:01 GBP
20:00 USD

Thursday, July 24, 2008

Today Prediction Forex

July 25, 2008

(Time are GMT+7 / Indonesia)

Sell GBP/USD (market order) at 15:00 PM

Always put a stop loss max 40 pips, and target profit starting 10 to 70 pips.

Monday, July 21, 2008

Currency Trading Market Conditions Suggest Range Trades will be Profitable

Written by David Rodriguez, Currency Analyst

Currency trading market conditions have been especially difficult to anticipate through recent trade, as broader financial markets have remained in an uncomfortable directionless chop. Our DailyFX 3-Month Volatility index remains above the historically significant 10 percent mark, but individual currency pairs nonetheless remain near the midpoint of their calendar year trading range. Such price action suggests that we may see further Rangebound price action in the week ahead. Our conviction in this call is relatively weak, however, as we feel there are continued risks of a short-term flare-up in market tensions and price volatility.

TradeSignal1_7-21

TradeSignal2_7-21


Preferred Strategies

Given market conditions very similar to those seen through last week’s report, we see little reason to change our standing bias on our DailyFX+ currency trading signals. Our preferred trading signals will come from Jamie Saettele’s Top/Bottom report, as it has outperformed all other DailyFX+ strategies through the past week of trade. Otherwise, we would expect certain range trades to prove profitable in the week ahead—making the “Pairs to Range” trade report an attractive proposition. Of course, we remind traders to avoid exceptionally volatile or strong-trending pairs. Finally, our SSI Trading Signals may continue to underperform on the lack of strong directionality in major currencies.

Discretionary Strategy Outlook

Tops and Bottoms – Given uncertain market conditions, our difficult-to-classify “Finding Tops and Bottoms” report is our preferred strategy in the week ahead. If nothing else, the “Tops and Bottoms” trading signals have banked respectable profits through recent trade—catching the Euro’s surprising break to the topside. Though there is no set trading style, the prospect of catching short-term Tops and Bottoms seems promising in the midst of nebulous price action.

Pairs to Range Trade – Major currencies saw breakouts of varying degrees through recent trading—damaging the otherwise solid prospects of major range trading strategies. That said, we are unsure of whether we can see price follow-through in the near term; given the broader directionless price action, we will claim that the “Pairs to Range Trade” report may offer attractive setups in the week ahead. Of course, traders must be mindful of the potential for adverse intraday moves and manage position size accordingly.

Speculative Sentiment Index Trading Signals – Our Speculative Sentiment Index clearly anticipated the Euro’s breakout to the topside and other key moves, but SSI trading signals have otherwise produced lackluster results through recently sideways markets. Our uncertain outlook leaves us with little choice but to claim that traders should use SSI trading signals with less size or not at all until market conditions become clearer.

Systems Outlook

Dynamic Carry Trade Basket – Please see our weekly report on Carry Trades for a better idea on what to expect through short-term trade: A Carry Trade Breakout a Matter of Time as Earnings and Credit Crowd Headlines.

Technical Analyzer and Signals from Thomson IFR
– Use own discretion to filter through IFR or Technical Analyzer signals in the week ahead.

TradeSignal3_7-21

Chart Definitions

Volatility Percentile – The higher the number, the more likely we are to see strong movements in price. This number tells us where current implied volatility levels stand in relation to the past calendar year of trading. We have found that implied volatilities tend to remain very high or very low for extended periods of time. As such, it is helpful to know where the current implied volatility level stands in relation to its calendar-year range.

Trend – This indicator measures trend intensity by telling us where price stands in relation to its 52-week range. A very low number tells us that price is currently at or near yearly lows, while a higher number tells us that we are near the highs. A value at or near 50 percent tells us that we are at the middle of the currency pair’s annual range.


Weekly Trading Lesson: Discretionary Trading vs. System Trading

Written by Thomas Long, FX Power Course Instructor

In our quest to develop a trading approach, a couple of weeks ago we decided that these were the keys points to include in our strategy:

1. Determine whether you are looking for a buy or a sell.
2. Find your entry.
3. Identify your initial risk.
4. Find your exit.


Last week we looked at how to satisfy the first rule in that we would look at the daily chart with one year of activity to find the strongest trends to trade. After having worked through a couple of dozen daily charts, I see the AUD/NZD to be in a strong uptrend. The chart posted first is the daily chart of the AUD/NZD and you can see that this market is moving straight up and has been for all of 2008. This is our first step in identifying the pair to trade and since it is in an uptrend, we will only look for buys and ignore all sell setups. Entries should be one of two situations for trend traders, we should look to buy a pullback down to support when the market is in an uptrend or look to sell a rally up to resistance when the market is in a downtrend. You could just look for these setups on the daily chart, but if we move down to a 4-hour chart, we can find more trading opportunities with lower risk. The key is going to be to only look for buys because the daily chart shows a strong uptrend. This increases our chance of success and puts us in a position to be in on some of the big moves that the FX markets are known for. So we are looking to buy on a pullback down to support. But what really does that mean if you don’t know how to identify support? This is where the use of technical indicators can come into play.

On the 4-hour chart below the daily chart, I have plotted a Slow Stochastics indicator with values of 15,5,5. The idea here is that you buy when the Slow Stochastics moves below 20 and then crosses over and moves up above 20. If we were looking for a sell, we would look for a move and a crossover above 80. I have circled those moves from below 20 to above 20 on the chart and you can see where they can help traders better time their entry. Technical indicators do not predict the future and can only show us changing momentum. But when that momentum changes at support when the market is in an uptrend, we have a classic buying opportunity. There are many other examples of how to use technical indicators to time your entry in earlier lessons posted in this forum, to include MACD and RSI. It really doesn’t matter which indicator you use as they are all just really fancy moving averages. I always recommend that traders use one or two that they find easy to use as that is what will make them effective. But once again the key is to try to quantify your entry so you are being consistent in the trades you choose. That is how you can see consistent results in your trading. Next week we will start on the subject of money management and how we can fine tune our approach to help us increase our chance of being consistently profitable.

weekly trading lesson 0721

Managed Futures Strategies

The total amount of assets under management in managed futures is today estimated to be in excess of $200 billion. Investors can choose from about 1000 programs, whose risk characteristics can extremely vary. It is therefore very important to fully understand the strategy each underlying manager is pursuing. We can not think of strategies on a stand-alone basis as a lot of managers employ them in combination, for example one main and several complementary strategies.

Technical approach
Here traders use technical analysis. It means that they monitor chart patterns and expect that they will repeat themselves in the future. The most common technical indicators usually include moving averages and strategies developed on the idea of a break through a specific price barrier. Moving averages were also used as the main method by the first managed futures fund, Futures Inc., founded in 1949 by Richard Donchian.

Fundamental approach
Traders do not follow historical data or price ranges where the market is located, instead they react upon the fundamental situation on the market. CTAs trade upon news, inventory levels, weather forecasts (which affect the crop), i.e. they focus on the situation between supply and demand. A fundamental approach is not typically used as the main strategy.

Systematic approach
Systematic managers use advanced mathematic and statistic methods in order to develop fully automated programs, which then generate trading signals and eventually transmit orders for execution. As a result of advances in technology this approach is naturally adopted more and more often.

The biggest company using a systematic approach is none other then AHL – the flagship program of the giant Man Group, a company that manages hedge funds, selects external managers for their funds of hedge funds, and is also the biggest futures broker. AHL took its name from the initials of its founders (Adam, Harding and Lueck). However, they left the company after the acquisition of Man Group to found Winton Capital and Aspect
Capital. Today, these companies (together with AHL) are managing about $30 billion.

Discretionary approach
A discretionary approach is the opposite to a systematic one. That means that managers take decisions over each trade individually. They are more specialized in a few selected markets.

Trend following
This strategy has the longest history and continues to be implemented most often. As indicated by the headline, positions are opened in the current market direction. Naturally, these traders need “trending” markets, i.e. those with long and uninterrupted trends without major corrections that might end the position.

An example of a trend-following trader could be John W. Henry. Using a combination with systematic approach, he managed to achieve very good results and later even bought Boston’s baseball team, the Red Sox. However, due to the absence of trending markets in the last three years the manager promoted to the Hall of Fame of futures trading suffered negative results of up to tens of percents annually.

Countertrend strategy
Traders who adopt this less-common strategy try to anticipate the price top/bottom and initiate a position against the current trend.

Option strategies
There are many strategies within the framework of option trading, but CTAs usually use option writing and here option spread trading only. Spread trading means they write (sell) options with the strike price over and under the current market price. They try to position themselves neutrally in order to profit from the situation wh

Forex
Currency strategies are sometimes presented as a stand along category. Another time they are for their same risk/return characteristics included among managed futures strategies.

Currency traders usually specialize in their market segment only and therefore are able to offer so-called passive strategies as well, which investors use to hedge their currency exposure. That is why forex managers have sometimes much more assets under management then managers in other strategies. An example can be FX Concepts, an American company managing about $12 billion, or London’s Record Currency Management managing as much as about $53 billion.

Short term / medium term / long term strategies
Under short term strategies we understand everything from intra-second trading (exclusively within a systematic approach) to holding a position for several days. The trading frequency is very high so it is important to monitor and analyze the impact of commissions and slippage.

An example of intra-second trading is RSJ Invest, a Czech company trading with the help of mathematical models of such a high volume that its activity counts for about 4% of total volume on London’s exchange Euronext.liffe.

Medium term positions are held from several days to several months. Option trades are a good example of this, with their length of about two months.

Long term strategies do not focus on hot news or the current market behaviour. Instead they monitor seasonal events and long term market tendencies. An example could be strategies developed on the basis of a fundamental analysis or spread trading of contracts with different months of delivery.

Sector specialists vs. diversified portfolio
In this case strategies are not necessary different, but there are specialist traders (focusing at “their” market only) or global players, who create highly diversified positions. Systematic CTAs are generally more diversified.
Due to high demand from investors a lot of strategies are currently emerging that focus on energies, metals and agriculture commodities. However, those are bank products rather than individual manager strategies or investment strategies of smaller firms.

Funds of funds
Funds of funds, better known as CPOs (commodity pool operators), specialize in the selection of best traders, from which they then create a diversified fund. The advantages are lower minimum investment and access to closed funds, the disadvantage extra fees for their activity.

en the market stays within the specified range over the specified period. The second (more conservative) strategy is the credit spread, where an option with nearer strike price is sold and an option with further strike price is bought. Such option specialists of course do not like trending markets.

The risk in option strategies varies substantially and therefore has given rise to a risk terminology in other strategies as well. Those are so-called “short option” and “long option” strategies. The risk in short option strategies could be hidden for a long time. It is possible to achieve very good returns for some period, but during an unexpected event a significant loss may occur, such as the one suffered by Victor Niederhoffer. His programs between 1993-1996 achieved solid stable returns and reached top positions in terms of traditional risk/return statistics. But after his short option positions on S&P 500 were hit in October 1997, he was forced to liquidate his funds.

Committed to the Markets

Many traders are seeking out assistance in their trading decisions from decision support tools we call technical indicators. While these are helpful, they are only to be used as support for our decision to buy where demand outstrips supply or to sell when supply overwhelms demand. We see this supply/demand imbalance on our charts as support and resistance. However, there is another useful data set that is independent of price that will give us clues as to the possible future of the markets. This data can be found in the Commitment of Traders report.

The Commitment of Traders (commonly referred to as the COT) report has been published by the Commodity Futures Trading Commission since 1962 and provides information on the open interest of futures contracts. The report can be found at www.cftc.gov and is published every Friday and contains the data from the previous Tuesday. A futures contract is a derivative which gets its value from an underlying asset. They are traded to either profit from future values of the asset or to hedge a position in the asset against a drop in price. The COT shows open interest in a multitude of commodity, currency, and stock index futures. Open interest differs from volume in that volume is the number of contracts actually traded per day while open interest is the number of contracts entered into, either long or short, that have not been offset by transactions or exercise. They are new or open contracts which can offer clues as to what the traders are anticipating price to do in the asset. This information can be used to assist us in our own trading decisions whether we are trading currency, commodities, futures, options, or even stocks.

The COT breaks down open longs and shorts into three categories. We have the Commercials, the Non-Commercials, and the Non-Reportables. The Commercials are people or businesses who deal directly with the underlying asset such as farmers, miners, and international businesses. With commodity futures, they understand the true supply and demand of the asset and are trying to hedge against future price movement that could hurt operating profits. They are not usually trying to profit from the futures contract itself. Stock index futures are used to hedge institutional portfolios and for arbitrage opportunities. The Non-Commercials are large speculators and can represent "smart money." They are speculating on the future movement of the trend in the underlying asset. The Non-Reportable positions are the so called "dumb money." There are the small individual traders trying to play the direction of the markets for profit and are often wrong.

The COT provides the open interest for both longs and shorts for all three categories of traders. Subtract the net shorts from the net longs in each category to see if the Commercials, Non-Commercials, and small traders are net long or net short. To use the COT data, you should keep a chart of the data and see what the trend is for the three groups. This is not the simplest task as you will have to manually enter the data each week from the COT report but it can be beneficial to do the work. Are the traders going net long or net short? Are they increasing their longs or their shorts? To trade with the trend, follow the Non-Commercials. Remember, this is the "smart money" that seeks to profit from price movement in the futures contract. If they are net short and increasing their shorts, look to go short yourself. If they are net long and increasing their net longs, look to open longs as well.

The most powerful trading signal comes when the Commercials and Non-Commercials are trending in one direction while the Non-Reportables (small traders), are trending in the opposite. The divergence of these groups shows the professionals taking money from the public and you should definitely follow the professionals for greater probability of success.

Forex Trading Strategy


What was my friend doing wrong?
After spending a few hours talking to him, reviewing his system and listening
to his trading experiences I came to the following conclusions.
There were THREE MAJOR problems with his trading method:

1. His Trading "System"

- His system was producing way too many entry signals

The efficiency (profitability) of the system is not based on the QUANTITY
of signals that it produces. It is based on the QUALITY of entry signals
that it produces. The entry signal needs to put probability of a trade moving
into your desired direction on YOUR side. His signals were working AGAINST him.

- His system was relying on lagging indicators

Most of the indicators that his system was using were so called lagging indicators.
Basically, it means that he was always the last one to enter a profitable trade
and the last one to get out of a losing trade.

- His system was not clearly defined

The system needs to have a clear set of entry and exit rules. It can not be left
up to the trader's discretion to decide when to enter the trade and when to get
out. In the real, professional system, you MUST enter the trade when the signal
occurs, because that is where your winning edge is in the long run.

2. His Mind Set

- He was always stressed out when his real money was inside the trade

You can not and should not trade with "scared" money. You can only trade with the
money that you can afford to lose. That will make you calm and therefore less
likely to make a bad judgment.

- He was getting out of winning trades too early

Even when his entry signals were good he was not able to extract maximum profit
from them. The MANTRA is "let your profits run". It is not "cut your profits short".
You need to extract MAXIMUM profit from EVERY single trade in order to be
profitable in the long run.
3. He did not pay attention to SENTIMENT
The forex market sentiment is the "collective" and intuitive opinion or better
to say "gut feeling" that is formed inside the forex trading community regarding
the future direction of a given currency pair (EUR/USD, USD/CAD, GBP/USD,
etc...). I'm sure that all of you who are already involved in the forex market have
noticed that sometimes, when market sentiment is negative for the particular
currency, even the best news can do nothing more than temporarily stop the negative
direction of that currency. For example, let's say that current opinion is that Central
Bank will rise interest rates by .25 points on the next meeting. And they actually raise
it by .50 points. If the sentiment for that particular currency was bullish or even
neutral, it would definitely trigger that particular currency to go higher. However,
if the sentiment was negative, all that would happen is that sell off of that
currency would stop for short period of time and then it would resume.

So, why is the sentiment important?

Sentiment is by far the most important tool at the hands of forex trader.
Why is it so? Because it gives to the forex trader a clue when NOT to take
particular trading signal. The power of successful forex trader is to know
when NOT to participate in the trade.
How this applies to you?
Let's say that you own a trading strategy that generates either bullish or bearish
signals for the particular currency pair. Sentiment will help you determine whether
to take the signal or to stay on the sidelines. If the signal is bearish but current
sentiment is bullish, you DO NOT take the signal. If the signal is bullish but current
sentiment is bearish, you DO NOT take the signal. You only take the signal if it is
confirmed by current sentiment.
I hope that you have learned something from my friend's mistakes. Look inside your
INBOX over the next couple of days as you will find out HOW TO determine the
current sentiment...
Best Regards.

How to use the Trin Indicator

Like any other day traders, we are always looking for correlation in other markets or indicators to give us an edge. It’s not easy when there are lots of data and techniques out there to choose from. Those that are out there simply work in one market but not in others while more work at one type of market condition and not in others and so on.
Scalping and day trading in particular has a peculiar type of behavior where everyone wants to know what the market will do in the next minute or so in order to catch a small tiny profit -- little by little to accumulate with highly leveraged trades. That said, every weapon helps to avoid losses and to add to the higher probability of success. Percentage is everything in this type of trading, the more wins, no matter how tiny, the more chances of survival. Discounting the commissions, which can be up to more than 30% round-trip on each trade (the profits are so tiny compared to fixed fee commissions), so the percentage needs to be high enough to cover them before profits is taken in (not including the taxman’s cut as well).
Many stock day traders use the typical broad market indexes to view the sentiment and trend of the markets to gauge the influence they have on the individuals stocks they monitor and trade. This helps see the tendency of the market to swerve one way versus another. Others use index futures such as the S&P 500, Dow and NASDAQ futures (like the e-minis) to gain a tiny milliseconds to see ahead of what others cannot see. In addition to that, futures are the hedging vehicles for the big players such as institutions, hedge funds, mutual funds, pension funds, and so on, so this aids in understanding what the big boys are thinking and doing.
The two most common and popular are the NYSE TICK and TRIN indexes. These two have been around for more than 30 years and still viable in today’s market conditions. While the TICK monitors all the NYSE stocks’ ticking up versus one ticking down, the TRIN monitors the volume. The TRIN (Trader’s Index) is also known as the Arms’ Index (named after the creator of the indicator). The formula is:

Advancing Issues/Declining Issues
TRIN = ______________________________________________
Volume of Advancing Issues/Volume of Declining Issues

This indicator separates declining issues from advancing issues and their respective volume and divides them to get a ratio. If the ratio is above 1, then there is there negative downtrend stock sentiment. Below ratio of 1, there is more positive uptrend stock sentiment.

Looking at an example, we’ll correlate the indicator with Russell 2000 futures:


Figure 1.
Although being above 1 or below is important, the main consideration is the trend of the line, where it is heading. On February 13, the entire day, the major trend has been from top to bottom, from above 1 to below 1. This indicated the day has been advancing most of the day-- not only number of advancing stocks but also the number of volume of those advancing stocks outnumbered the declining ones and their volume.


Figure 2.
Checking figure 2, the Russell 2000 has been advancing, following the general sentiment of the market: up. This confirms the overall mood of the market and, in turn, helps the trader determine which way the momentum is going and he would go with it. This would increase the probability that the trade will succeed when following the direction of the market and its momentum.
The best moment to enter is the TRIN pulling back; when it turns and heads toward prevailing direction, it is the moment to enter in the stock the trader is watching.
Using this in tandem with the signals from NYSE TICK to confirm market breadth is a powerful combination. It takes some use to understand how the two will provide clear signals to make a precise entry and exits. Like everything else, practice makes perfect.